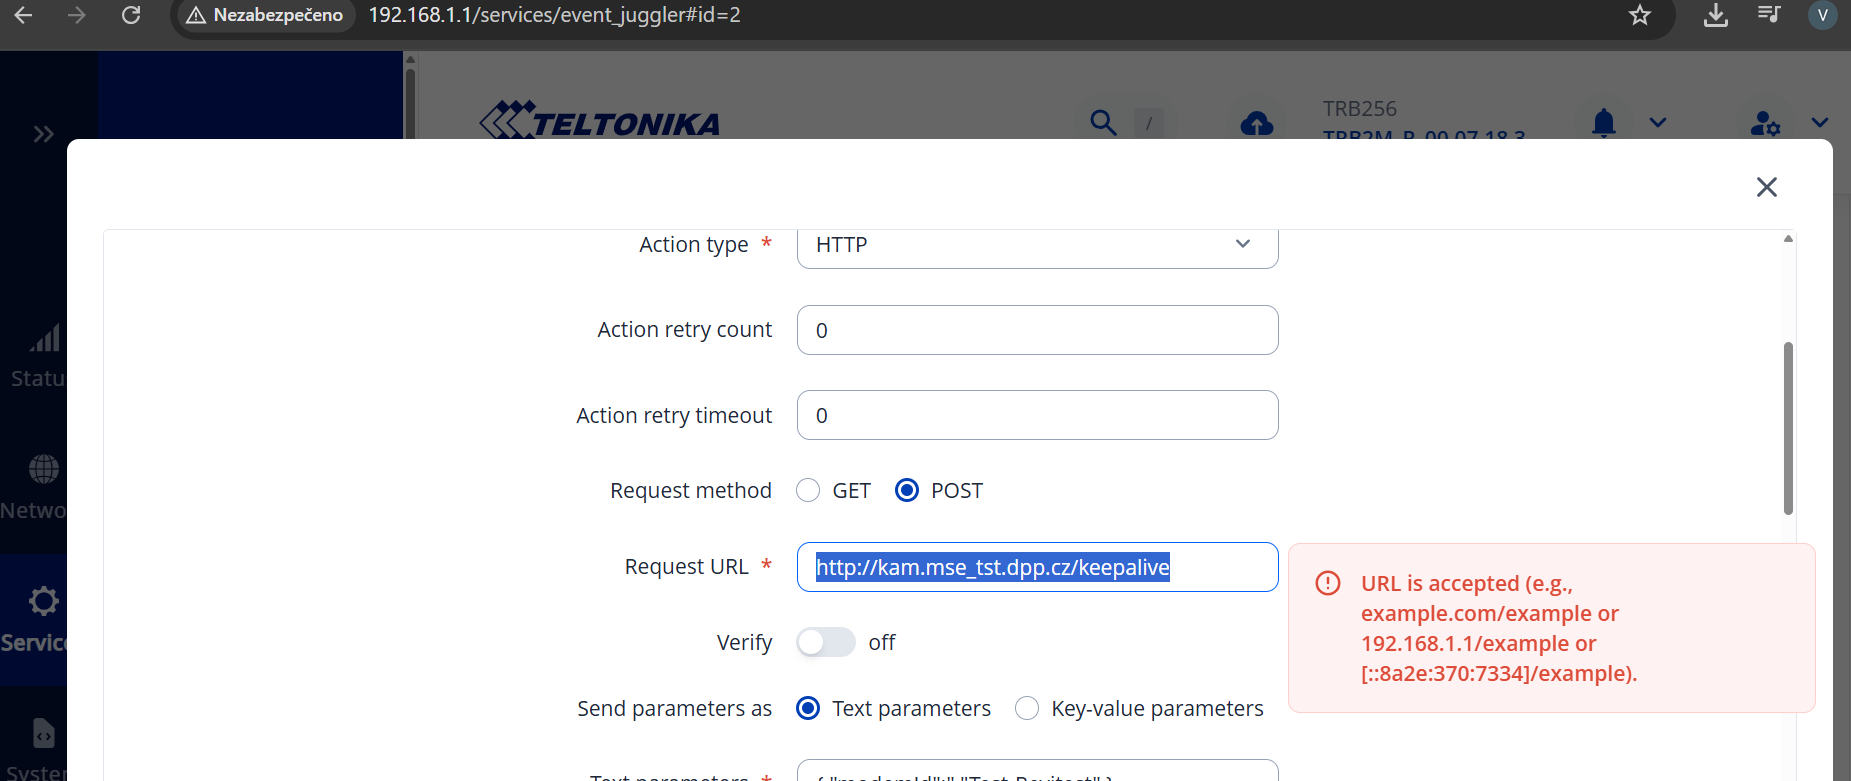
Thank you for reply, after upgrading FW event juggler appeared - thats great. Also step by step manual was good, but I have a problem with url address.
I need to put there this address: http://kam.mse_tst.dpp.cz/keepalive and the UI has a problem with “_”
The “_” symbol isn’t allowed in the domain name part of a URL. It can only be used in the path or query portion. If you need a separator, the “-” symbol is valid and should be used instead.
I would like to ask for assistance regarding HTTPS communication on the TRB256 device.
We need the unit to send HTTPS POST requests (to an Event Juggler service) from within a client’s private network. The target server uses a self-signed certificate.
Could you please confirm the following:
Does the TRB256 fully support HTTPS for outbound POST requests? (in “Ation type” there is only HTTP no HTTPS)
Is it possible for the TRB256 to accept and work with a self-signed certificate?
In case the device does not trust the certificate by default, is there an option to manually upload/import a custom CA or certificate into the TRB256 so that HTTPS communication can function properly?
Any guidance or relevant documentation would be greatly appreciated.
It also seems unlikely to me that TRB256 wouldn’t be able to handle this; I’m more inclined to think that maybe the event juggler simply doesn’t support it. If that’s the case, would it be possible to add this functionality?
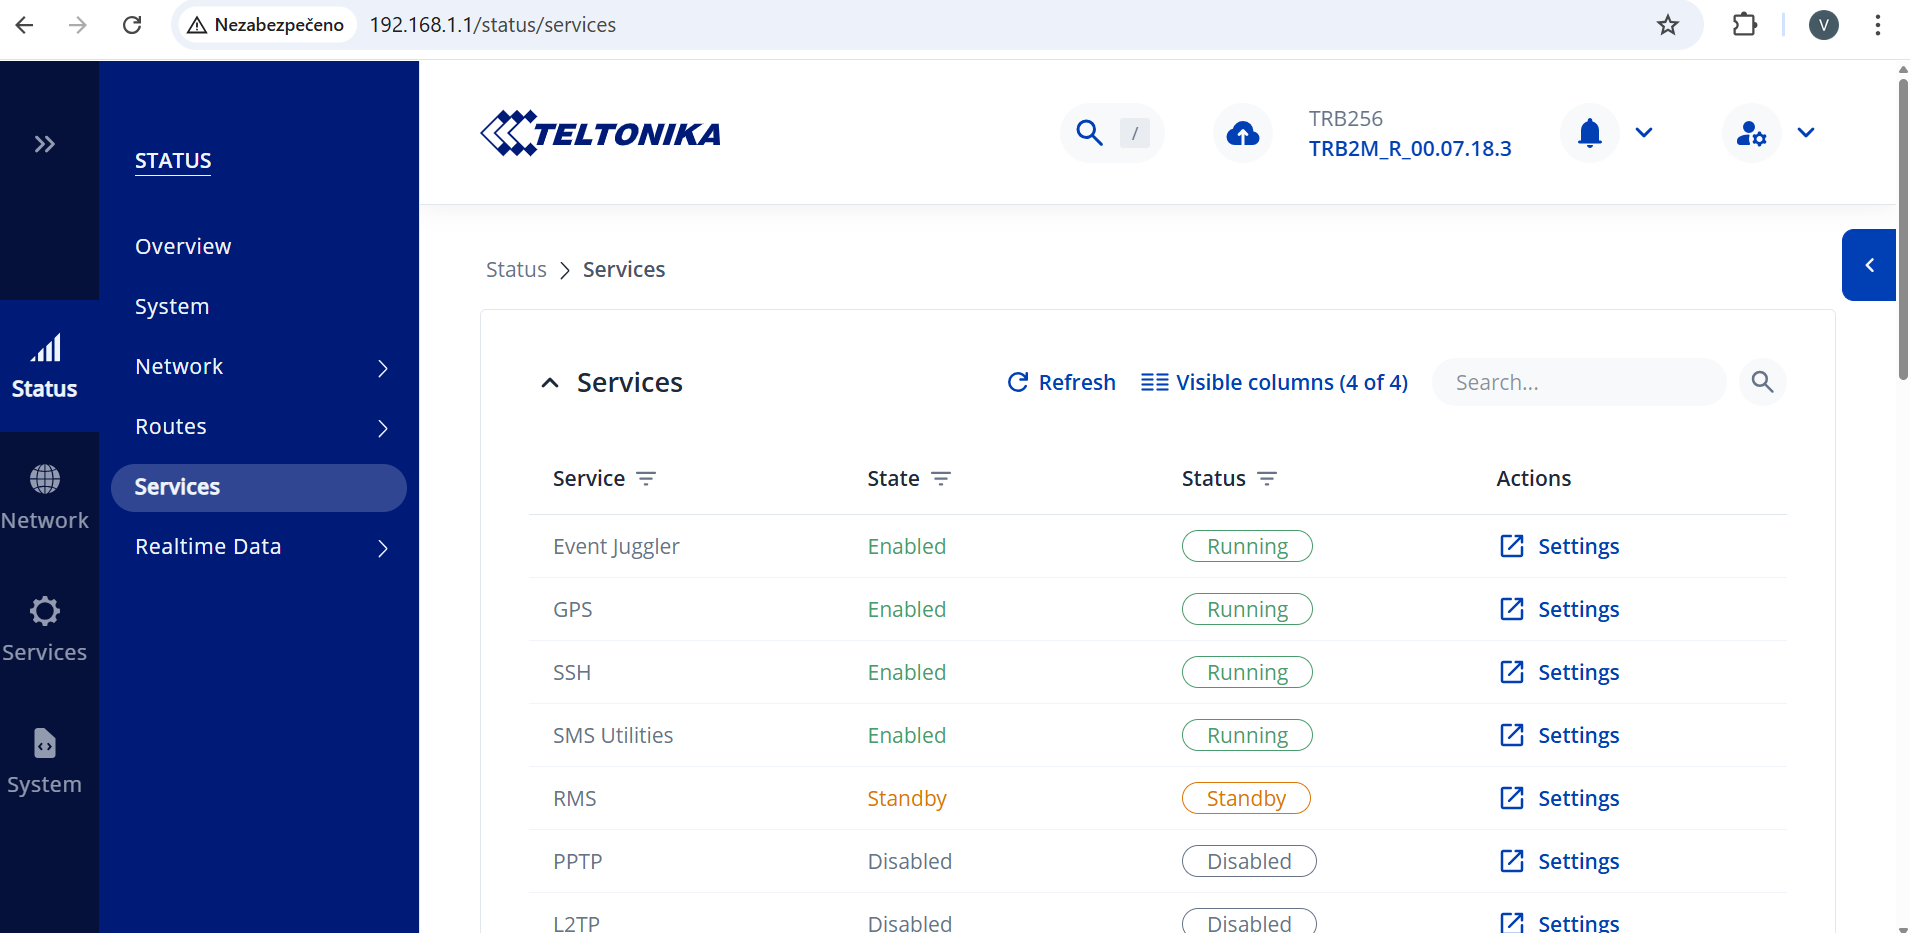
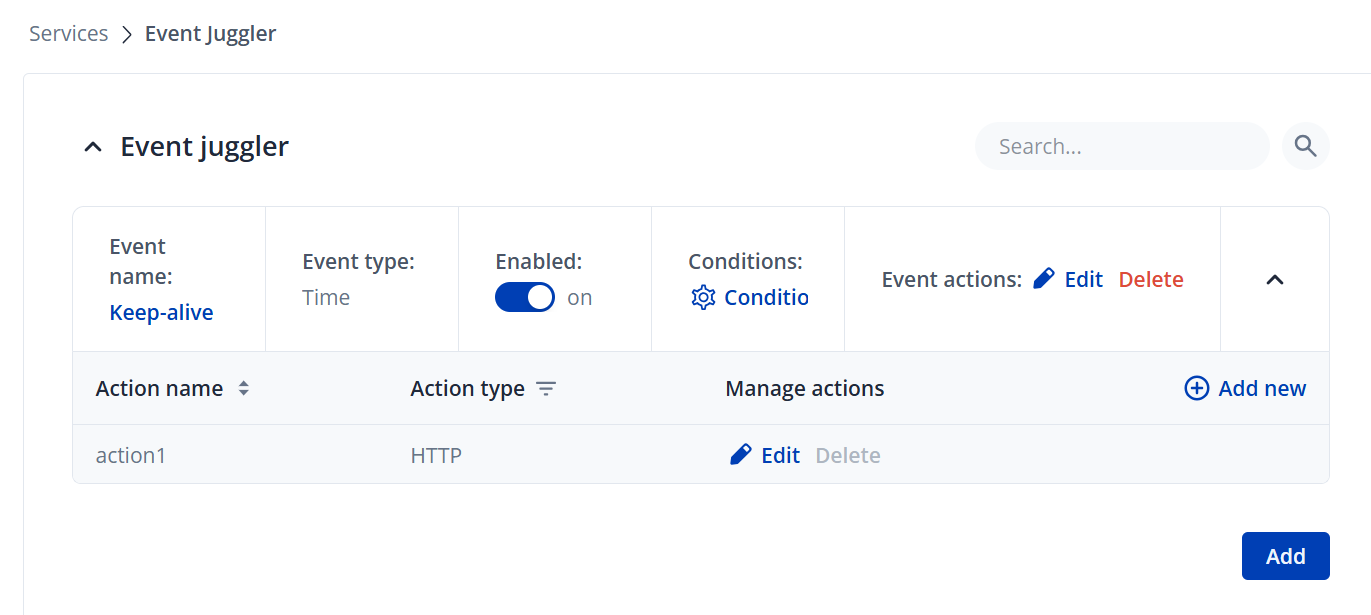
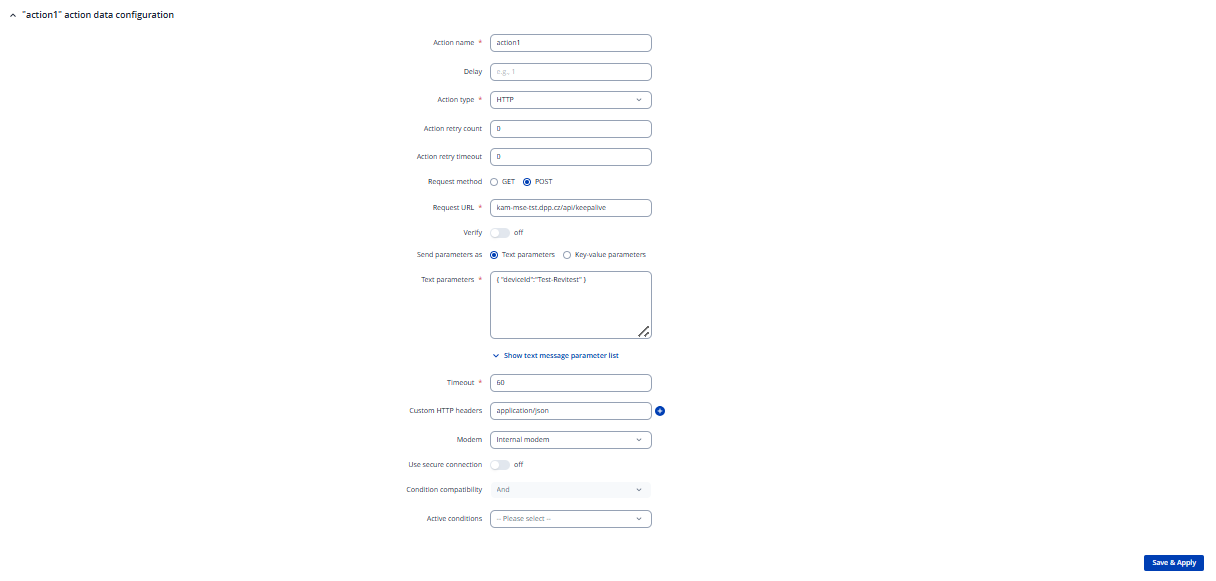
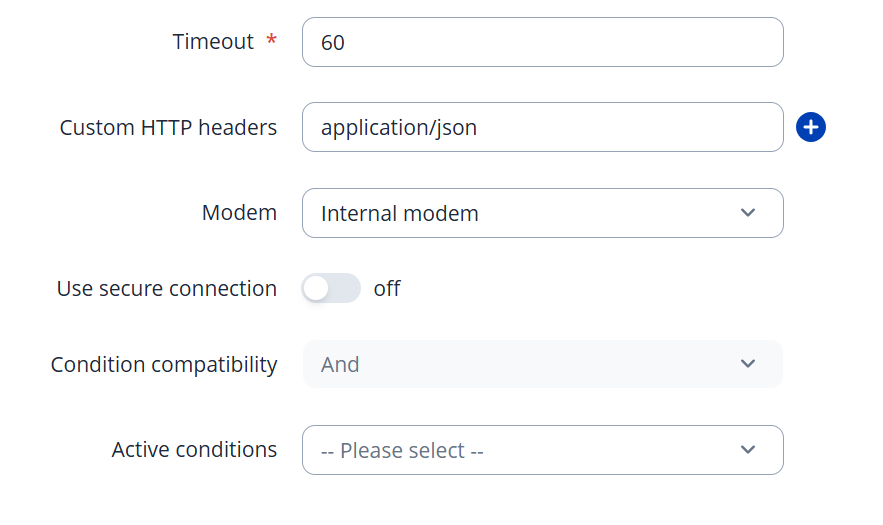
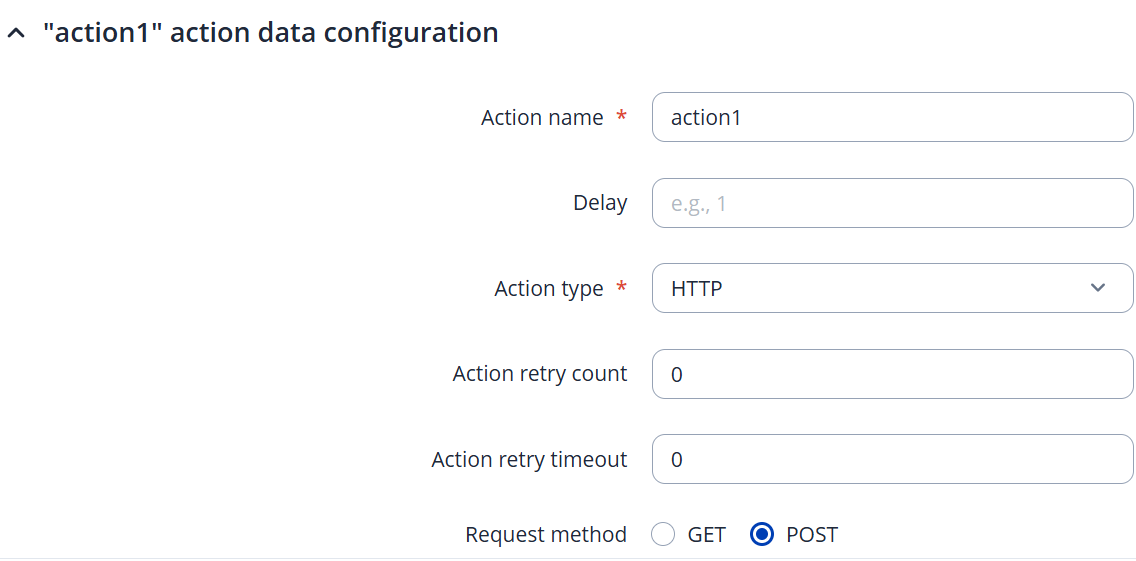
I have configured the Event Juggler on my TRB256 according to your previous instructions (see attached screenshots). However, the server still does not receive any data from this device.
The server is receiving data correctly from other devices, so the issue seems to be related to TRB256 or its Event Juggler configuration.
I checked the System Log, but I cannot find any entries showing that the Event Juggler action was triggered or that the data was sent.
Could you please advise:
Is there any dedicated log where I can verify that the Event Juggler executed the action?
Should HTTP actions performed by the Event Juggler be visible in the System Log or another log?
If logging needs to be manually enabled, where can I enable it?
At the moment I cannot confirm that the device is sending anything at all, so any guidance on how to properly monitor or debug Event Juggler activity would be greatly appreciated.
For testing purposes, port 80 is temporarily open on the server and the Event Juggler is configured to send data via HTTP. The TRB256 is connected to my computer via LAN cable, and from my computer I can successfully ping the server and also connect to port 80 using Telnet. Therefore, basic network connectivity should not be an issue.
https connection can be made with “Use secure connection” and “Verify” after they are enabled CA file upload will appear.
Logs can be seen by going to System > Maintenance > Troubleshoot > Troubleshoot logs and clicking System logs button. You can also search for “event_juggler”. Or with logread via CLI. “Event log” does not show event juggler logs.
Successful event juggler events should look like this:
909 Fri Dec  5 07:16:00 2025 daemon.info event_juggler: [1] Event triggered
910 Fri Dec  5 07:16:00 2025 daemon.info event_juggler: [2] Action performed
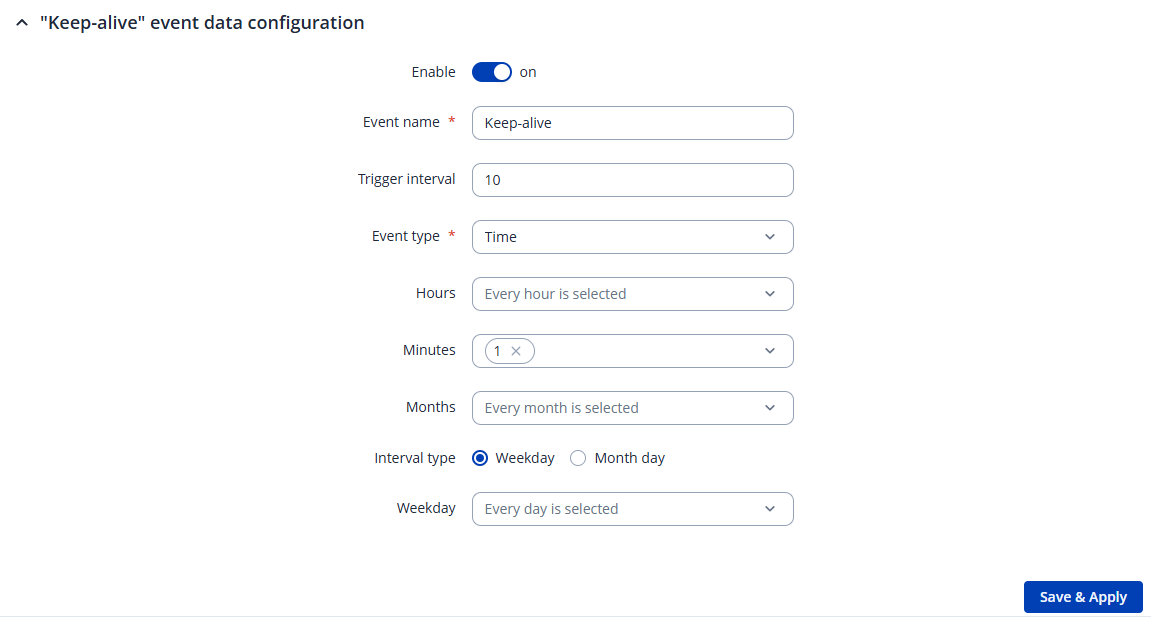
Also keep in mind that your current config will send requests once a hour on 1 minute mark. Not once a minute like you initially asked for.
Also check “Conditions” configuration - it should be empty.
Thanks for quick reply.
In the system log I repeatedly see the following messages:
daemon.info event_juggler: [1] Time event triggered
daemon.info event_juggler: [1] Event triggered
daemon.info event_juggler: [2] Action performed
From these logs it looks like the event was triggered and the action was executed, but no data is arriving on the target server. I need to verify whether Event Juggler actually sends the data (HTTP), or if these log entries only indicate the event execution internally without confirming that packets were truly sent out.
Could you please clarify:
Do these messages confirm that the data was actually transmitted, or only that the action was triggered?
Where can I find more detailed logs of the actual transmission in TRB256?
What is the recommended method to verify that data is really being sent out from the router?
Because of this, I’m not sure what else to try or where the issue might lie. Could you please advise how to proceed?
The device always reports “Action performed” (not “Action failed”)
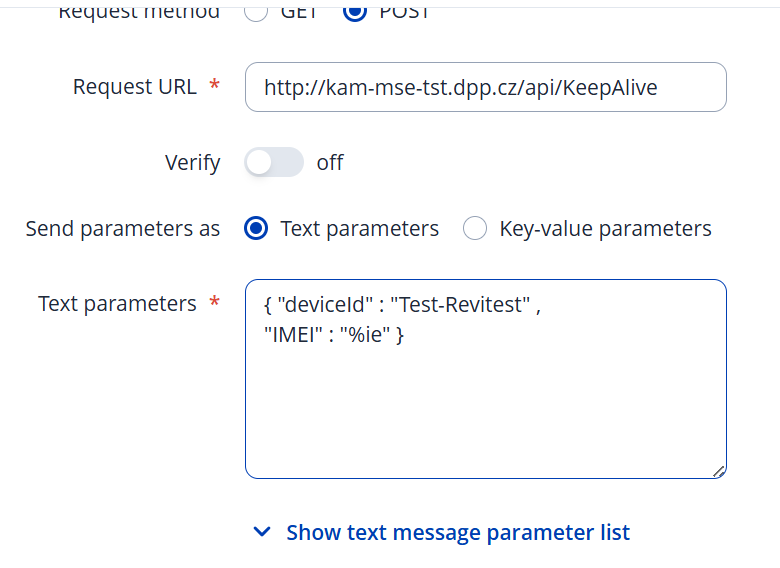
Also — as an aside — is there a way to include an IMEI number in the JSON payload I’m sending?
Not sure if your server is case sensitive on “KeepAlive” part but this might be the problem.
Url in your manual test:
Url in your config:
Yes that it is possible to include IMEI. Click on “Show text message parameter list” to see all available values. I think it should be something like this { "deviceid": "%ie" }
I rewrited the KeepAlive, but still I have problems:
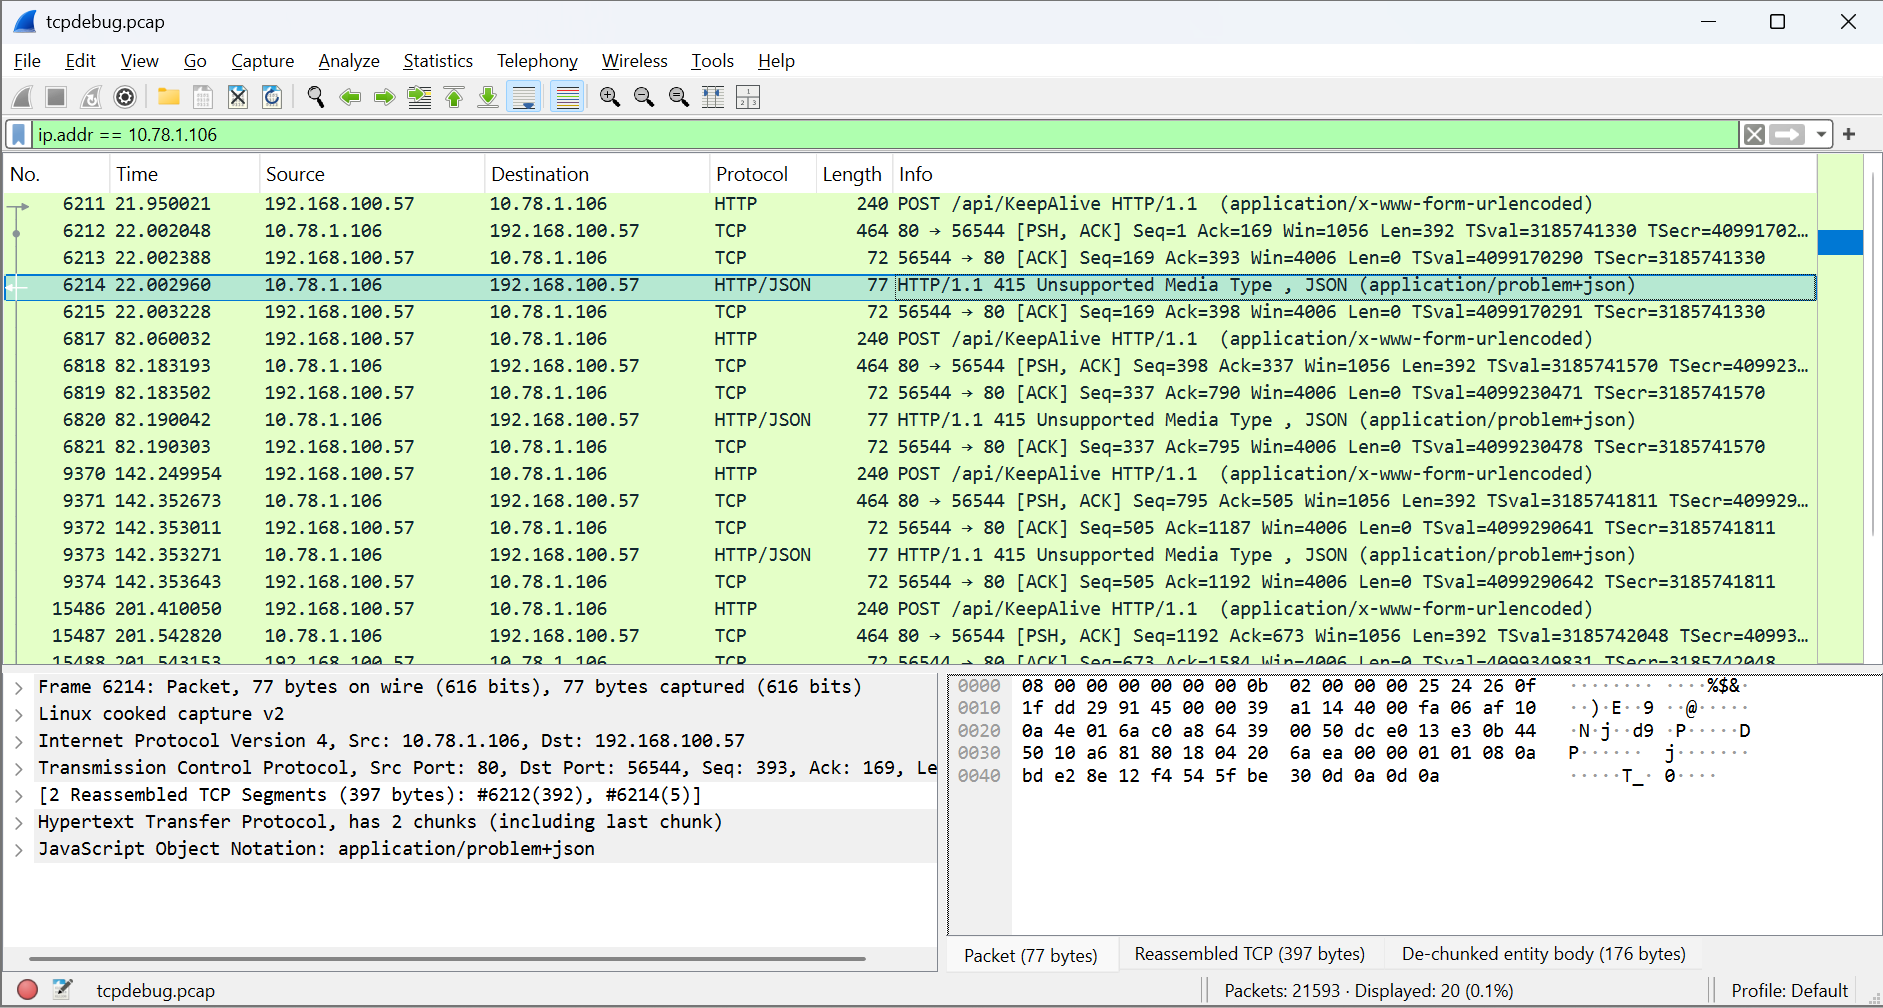
My address is 192.168.100.57 and server is 10.78.1.106 - and If I understand it correctly, Teltonika is sending x-www-form-urlencoded but the server needs to send it in JSON - can you advice me how to do that, please?
My goal is to establish a secure HTTPS connection using the certificates already present on the server, without having to upload any CA certificates into the TRB256 device itself.
In other words, I would like the TRB256 to verify the server’s certificate using the CA chain provided by the server during the TLS handshake, rather than requiring a separate CA file to be stored on the device.