After installing RUT2M_R_00.07.09 on our RUT241, I started getting timeouts when pulling SNMP statistics. After inspection, it turned out that the snmpd daemon was causing issues - creating 100% CPU load. Disabling snmpd solved the issue. I’ve rolled back to RUT2M_R_00.07.08.2 on our RUT241
On our RUTX50 and TRB140 devices, I do not see the same issue.
I would like to review a troubleshoot file. I have sent you a form to fill out. Once completed, I will contact you privately regarding this. For the ticket ID, please use “7723”.
Could you please clarify whether you are performing a full SNMP walk or simply requesting individual SNMP objects? Additionally, is there any pattern in the specific SNMP objects being requested? Understanding this might help us pinpoint whether the issue is related to a particular set of requests or if it occurs under specific conditions.
I’m sorry for not getting back to you sooner. I’m using SNMP exporter from prometheus. It walks the following oid’s every 20 seconds with a 20s timeout:
This is a snippet from the snmp.yml config file for SNMP-exporter.
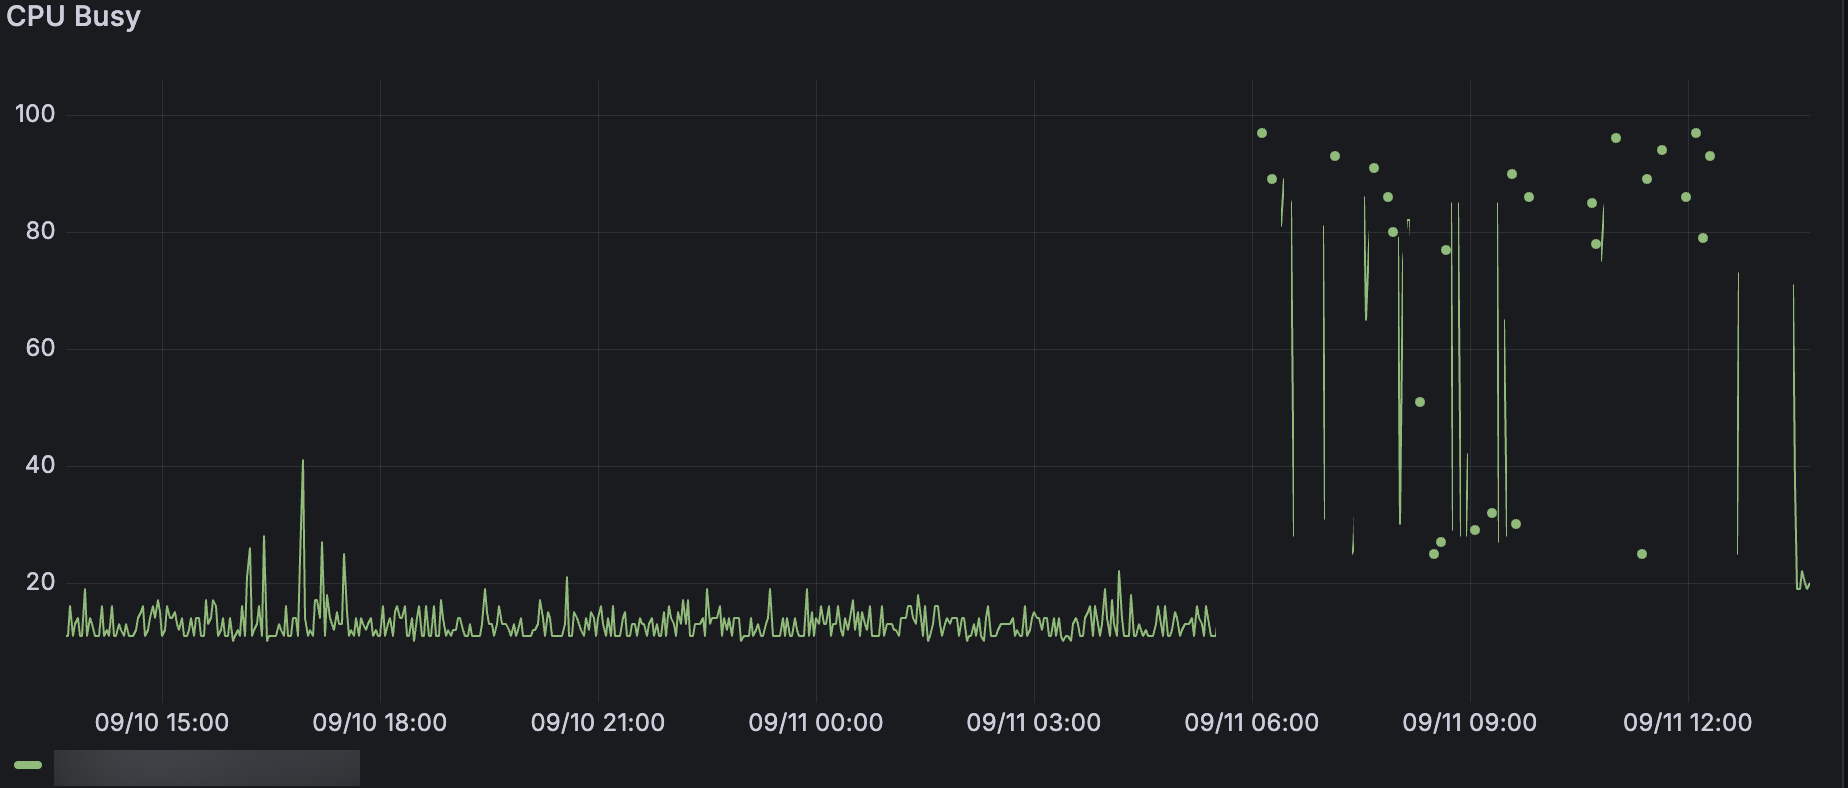
I have upgraded our test RUT360 to 7.14.3. We still see the same behaviour - see screenshot below. In this test, we’ve configured our SNMP exporter to walk the SNMP MiBs listed in my previous post every 20sec. You can see where I started the SNMP test, in the middle of this graph.
I’ve sent you a form to fill out. Once it’s completed, I will contact you privately regarding this issue. Please use the ticket ID "7723-2" when submitting the form.
Hi @Marija, if your last message was directed at me, I haven’t received any form. I’m not sure by which “private” method you are going to use to contact me.
You should receive a form at the email address you used to register on the community forum. I have re-sent the form, please let me know if you received it this time. Also, kindly check your spam/junk folder just in case.