TRB500 running at 100% CPU load

Hi all,

I am running a TRB500 (current FW is TRB500_R_00.07.23.7) for some years. During the current heat wave I discovered that the device is running quite hot. A closer look revealed that it is running on 100% CPU load with one process eating up all of the CPU. Rebooting the device has not resolved the issue. It went straight to 100% load again.

CPU: 27% usr 71% sys 0% nic 0% idle 0% io 0% irq 0% sirq
Load average: 2.43 2.38 2.27 3/267 19427
PID PPID USER STAT VSZ %VSZ %CPU COMMAND
18599 1 zebra R 12328 5% 96% /usr/local/usr/sbin/zebra -A 127.0.0.1 -u zebra -g frr
9410 1 nlbwmon RN 2348 1% 1% /usr/sbin/nlbwmon -o /usr/local/share/nlbwmon/data.db -b 524288 -i 12h -r 10s
11892 1 mdcollec S 3452 2% 0% /usr/bin/mdcollectd -i 10 --ignore lo

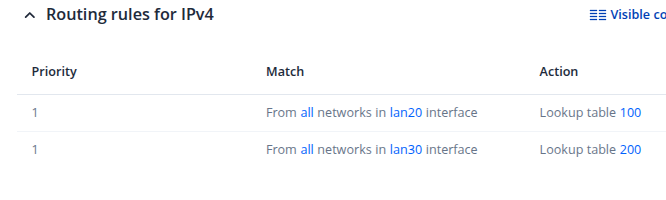
I am running two PBR rules to separate management traffic (WebUI, SSH, SNMP) from the rest (BGP, traffic from the local network to the internet) running on a different VLAN interface. To share routes between the TRB500 and my other router I am using BGP.

The time when I configured the TRB500, everything was running fine with no high CPU load, but the traffic on the device was just a few MB a day. Now it is around 12GB a day.

Is this expected behavior because of the PBR done in software or is something broken on my setup?

Thanks a lot for the help
Hi, @digifuchsi

I have a RUTX12 with only two rules for PBR.

AND the CPU are very low…

image

zebra is the obvious culprit here.

You can try to strace it to see what it is doing:

strace -v -y -f -ff -p 18599

and post an extract of the output.

strace isn’t available on my device and I haven’t found it on the WebUIs Package Manager. Is ist possible to install it another way?

Try:

opkg -e /etc/opkg/openwrt/distfeeds.conf update

opkg -e /etc/opkg/openwrt/distfeeds.conf install strace

Thanks a lot. I got strace installed.

When running strace I got this repeating output:

[pid 23059] rt_sigprocmask(SIG_SETMASK, [], NULL, 8) = 0
[pid 23059] clock_gettime64(CLOCK_MONOTONIC, 0xbea38ae0) = -1 ENOSYS (Function not implemented)
[pid 23059] clock_gettime(CLOCK_MONOTONIC, {tv_sec=71975, tv_nsec=616480510}) = 0
[pid 23059] clock_gettime64(CLOCK_MONOTONIC, 0xbea38aa8) = -1 ENOSYS (Function not implemented)
[pid 23059] clock_gettime(CLOCK_MONOTONIC, {tv_sec=71975, tv_nsec=617225927}) = 0
[pid 23059] rt_sigprocmask(SIG_BLOCK, [HUP INT USR1 TERM], [], 8) = 0
[pid 23059] ppoll([{fd=10<socket:[192126]>, events=POLLIN}, {fd=20<socket:[192138]>, events=POLLIN}, {fd=21<socket:[192140]>, events=POLLIN}, {fd=22<socket:[192141]>, events=POLLIN}, {fd=5<pipe:[192097]>, events=POLLIN}], 5, {tv_sec=0, tv_nsec=0}, [], 8) = 0 (Timeout)

[pid 23059] rt_sigprocmask(SIG_SETMASK, [], NULL, 8) = 0
[pid 23059] clock_gettime64(CLOCK_MONOTONIC, 0xbea38ae0) = -1 ENOSYS (Function not implemented)
[pid 23059] clock_gettime(CLOCK_MONOTONIC, {tv_sec=71975, tv_nsec=621531552}) = 0
[pid 23059] clock_gettime64(CLOCK_MONOTONIC, 0xbea38aa8) = -1 ENOSYS (Function not implemented)
[pid 23059] clock_gettime(CLOCK_MONOTONIC, {tv_sec=71975, tv_nsec=622153687}) = 0
[pid 23059] rt_sigprocmask(SIG_BLOCK, [HUP INT USR1 TERM], [], 8) = 0
[pid 23059] ppoll([{fd=10<socket:[192126]>, events=POLLIN}, {fd=20<socket:[192138]>, events=POLLIN}, {fd=21<socket:[192140]>, events=POLLIN}, {fd=22<socket:[192141]>, events=POLLIN}, {fd=5<pipe:[192097]>, events=POLLIN}], 5, {tv_sec=0, tv_nsec=0}, [], 8) = 0 (Timeout)

[pid 23059] rt_sigprocmask(SIG_SETMASK, [], NULL, 8) = 0
[pid 23059] clock_gettime64(CLOCK_MONOTONIC, 0xbea38ae0) = -1 ENOSYS (Function not implemented)
[pid 23059] clock_gettime(CLOCK_MONOTONIC, {tv_sec=71975, tv_nsec=626204573}) = 0
[pid 23059] clock_gettime64(CLOCK_MONOTONIC, 0xbea38aa8) = -1 ENOSYS (Function not implemented)
[pid 23059] clock_gettime(CLOCK_MONOTONIC, {tv_sec=71975, tv_nsec=627091396}) = 0
[pid 23059] rt_sigprocmask(SIG_BLOCK, [HUP INT USR1 TERM], [], 8) = 0
[pid 23059] ppoll([{fd=10<socket:[192126]>, events=POLLIN}, {fd=20<socket:[192138]>, events=POLLIN}, {fd=21<socket:[192140]>, events=POLLIN}, {fd=22<socket:[192141]>, events=POLLIN}, {fd=5<pipe:[192097]>, events=POLLIN}], 5, {tv_sec=0, tv_nsec=0}, [], 8) = 0 (Timeout)

Looks like zebra is stuck in a loop isn’t it?

Yes this is a bug.

Edit: not so fast, this thread loops once every ~5 ms, it doesn’t seem to be the culprit.

Is there another thread looping without doing any system call ? To check, use gdb:

gdb /usr/local/usr/sbin/zebra 18599

Once gdb is ready do:

thread apply all bt

What do you see ?

gdb is showing this:

# gdb /usr/local/usr/sbin/zebra 1560
GNU gdb (GDB) 10.1
Copyright (C) 2020 Free Software Foundation, Inc.
License GPLv3+: GNU GPL version 3 or later <http://gnu.org/licenses/gpl.html>
This is free software: you are free to change and redistribute it.
There is NO WARRANTY, to the extent permitted by law.
Type "show copying" and "show warranty" for details.
This GDB was configured as "arm-openwrt-linux".
Type "show configuration" for configuration details.
For bug reporting instructions, please see:
<https://www.gnu.org/software/gdb/bugs/>.
Find the GDB manual and other documentation resources online at:
    <http://www.gnu.org/software/gdb/documentation/>.

For help, type "help".
Type "apropos word" to search for commands related to "word"...
Reading symbols from /usr/local/usr/sbin/zebra...
(No debugging symbols found in /usr/local/usr/sbin/zebra)
Attaching to program: /usr/local/usr/sbin/zebra, process 1560
[New LWP 1596]
[New LWP 1597]
[New LWP 1598]
[New LWP 1603]
[New LWP 1604]

warning: Unable to find dynamic linker breakpoint function.
GDB will be unable to debug shared library initializers
and track explicitly loaded dynamic code.
0xb6f3e738 in ?? ()
(gdb) thread apply all bt

Thread 6 (LWP 1604 "zebra_apic"):
#0  0xb6f3af20 in ?? ()
#1  0xb6f3ba80 in ?? ()
Backtrace stopped: previous frame identical to this frame (corrupt stack?)

Thread 5 (LWP 1603 "zebra_apic"):
#0  0xb6f3af20 in ?? ()
#1  0xb6f3ba80 in ?? ()
Backtrace stopped: previous frame identical to this frame (corrupt stack?)

Thread 4 (LWP 1598 "zebra_opaque"):
#0  0xb6f3af20 in ?? ()
#1  0xb6f3ba80 in ?? ()
Backtrace stopped: previous frame identical to this frame (corrupt stack?)

Thread 3 (LWP 1597 "zebra_dplane"):
#0  0xb6f3af20 in ?? ()
#1  0xb6f3ba80 in ?? ()
Backtrace stopped: previous frame identical to this frame (corrupt stack?)

Thread 2 (LWP 1596 "RCU sweeper"):
#0  0xb6f19f78 in ?? ()
#1  0xb6bbc690 in ?? ()
Backtrace stopped: previous frame identical to this frame (corrupt stack?)

Thread 1 (LWP 1560 "zebra"):
#0  0xb6f3e738 in ?? ()
#1  0x00000000 in ?? ()
Backtrace stopped: previous frame identical to this frame (corrupt stack?)
(gdb) 

Had some time to focus on the issue a little bit more. It seems that BGP is causing the high load on the TRB500:

When I disable the BGP daemon on my router (Ubiquity ER-4) and leave BGP running on the TRB500 zebra is still eating all of the CPU even when no BGP peering is active.
When I disable the BGP daemon on the TRB500 the CPU usage instantly drops to 1-2%.

EDIT: I just added all BGP learned routes as static routes on my TRB500 and Ubiquity ER-4 and the load is still at 1-2%. Everything is working fine even with traffic through the TRB500. It seems that somehow the BGP daemon is causing zebra to freak out or my BGP config got messed up.

The backtraces aren’t very informative !

Something might be wrong on the BGP side however zebra shouldn’t exhibit this behavior.

Yeah they really aren’t telling anything.

For the lack of better ideas I deleted my whole BGP config, deinstalled the package an reinstalled it again. Without any configuration done, just enabling the BGP daemon will make the zebra process freak out and use 100% CPU.

It works for now with the static routes configured, but it is not that great. I may try resetting everything to factory defaults next week. I hope that something is messed up and will get corrected that way.

It would be interesting to have a zebra binary compiled with debug information.

I can confirm pretty much this exact behavior, only in my case, I’m trying to setup ospfd. Once the service is started, without any configuration, zebra eats up 100% of the cpu. strace or gdb give no useful insight.

BIRD routing daemon should be considered as an alternative, in my experience is more lightweight and has far less issues.

Hello, @saso ,

Apologies for a delayed response,

To proceed with a root cause investigation, we need the following additional information:

  1. FRR/zebra package version currently installed on the device (this can be checked via opkg list-installed | grep frr over SSH).
  2. Firmware history - was BGP previously confirmed working correctly on an earlier firmware version, and if so, which version? Do you recall which firmware the device was running when BGP was last stable at low CPU?
  3. Confirmation of whether the issue reproduces on a factory-reset unit with only BGP enabled via Network → Routing → Dynamic routes → BGP, and no other configuration applied.
  4. If possible, an aggregated syscall trace: strace -c -p <zebra_pid> run for ~30 seconds while the issue is occurring, and the resulting output.
  5. logread output covering the moment the BGP daemon is enabled and zebra CPU usage spikes.

Once we have this information, we will be able to determine whether this is a firmware-specific regression or a broader FRR-related defect, and escalate accordingly to our R&D team if needed.

We appreciate your patience and thorough testing on this matter.

Best regards,
V.
