To whom it may concern:
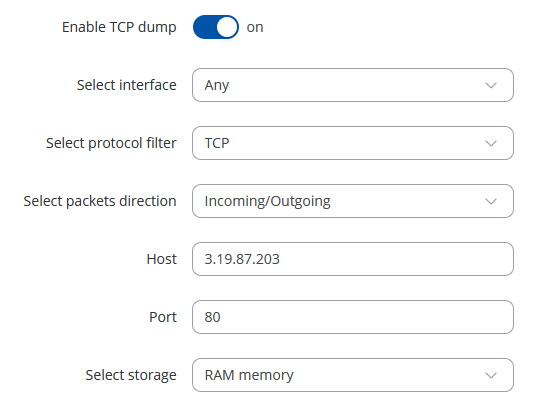
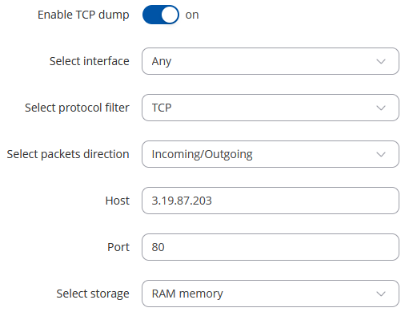
While debugging the Data-To-Server functionality on a RUT360 I required tcpdump to debug the traffic from the router to my Ubidots account since I found no other means of looking at the CURL message payload. I installed the tcpdump package and proceeded to configure the tcpdump trace under: System → Maintenance → Troubleshoot. I set the traffic filter as follows:
After clicking Save & Aply I noticed that the tcpdump process was not running. If I instead configure the tcpdump service without ptocol filter the service script works fine:
 ps -w | grep tcpdump
29487 root      5092 S    /usr/sbin/tcpdump -i any -Q inout -C 20 -W 1 host 3.19.87.203 and port 80 -w /tmp/tcpdebug.pcap
Configuring tcpdump with protocl filter but no host or port filter also works:
But the composition of the tcpdump command is not what I expected. IMHO, the host and port parameters should be part of the filter and not the options.
The RUT360 is running RUT36X_R_00.07.07.3.
Have a look at the [test] && statements in the tcpdebug script!
I have tested this on multiple routers with different firmware and noticed that the process is not visible in the ps command, but it still generates a .pcap file. It seems to be a visual bug of some sort. Did the log generate for you when you tried to download TCPdump?
Hi Marijus,
Thanks for the quick response.
With all due respect, your answer defies my experience and understanding of how Linux processes work.
I have never encountered a situation where an executed command or running background process doesn’t show up in the ps output.
The bug is in the service script logic/code! If you analyze it closely you will notice that, on entry of either protocol filter (TCP, UDP, etc) and host IPaddr and/or port the resulting tcp command would be:
# tcpdump -i <interface> -Q <direcction> <filter> -C 20 -W 1 host <IPaddr> and port <port#>
This will not work! It returns code 1 (error).
Try the command with the correct composition:
# tcpdump -C 20 -W 1 -i <interface> -Q <direcction> <filter> and host <IPaddr> and port <port#>
and you get a running tcp trace:
# /usr/sbin/tcpdump -C 20 -W1 -i any -Q inout tcp and host 192.168.1.1 and port 80 &
tcpdump: data link type LINUX_SLL2
tcpdump: verbose output suppressed, use -v[v]... for full protocol decode
listening on any, link-type LINUX_SLL2 (Linux cooked v2), snapshot length 262144 bytes

# ps -w | grep tcpdump
20745 root      5072 S    /usr/sbin/tcpdump -C 20 -W1 -i any -Q inout tcp and host 192.168.1.1 and port 80
Ergo, the culprit is in the script!
I hope this clarifies any doubts on your side about the existence of a bug in the tcpdebug script’s logic.
We will investigate this further. However, could you provide a screenshot of the error message produced by tcpdump? I was unable to reproduce the issue using the same or similar tcpdump flags.
Additionally, could you answer the following question regarding these settings:
Does it produce a downloadable file with some sort of traffic via the “download” button?
Hello Marijus,
Regarding the tcpdump error: it does not print any mesage. You have to look at the return code! # echo $? after command execution. If return code = 0 all is well, else tcpdump ended in an error condition.
If the tcp command is successful you should see: (do not use the -w parameter!)
tcpdump: data link type LINUX_SLL2
tcpdump: verbose output suppressed, use -v[v]... for full protocol decode
listening on any, link-type LINUX_SLL2 (Linux cooked v2), snapshot length 262144 bytes
Regarding your second question: if tcpdump fails to start it will not create a tcpdebug.pcap file.