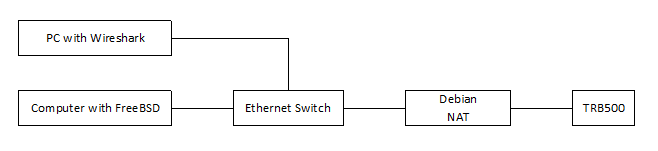
I have an application that doesn’t work when using TRB500.
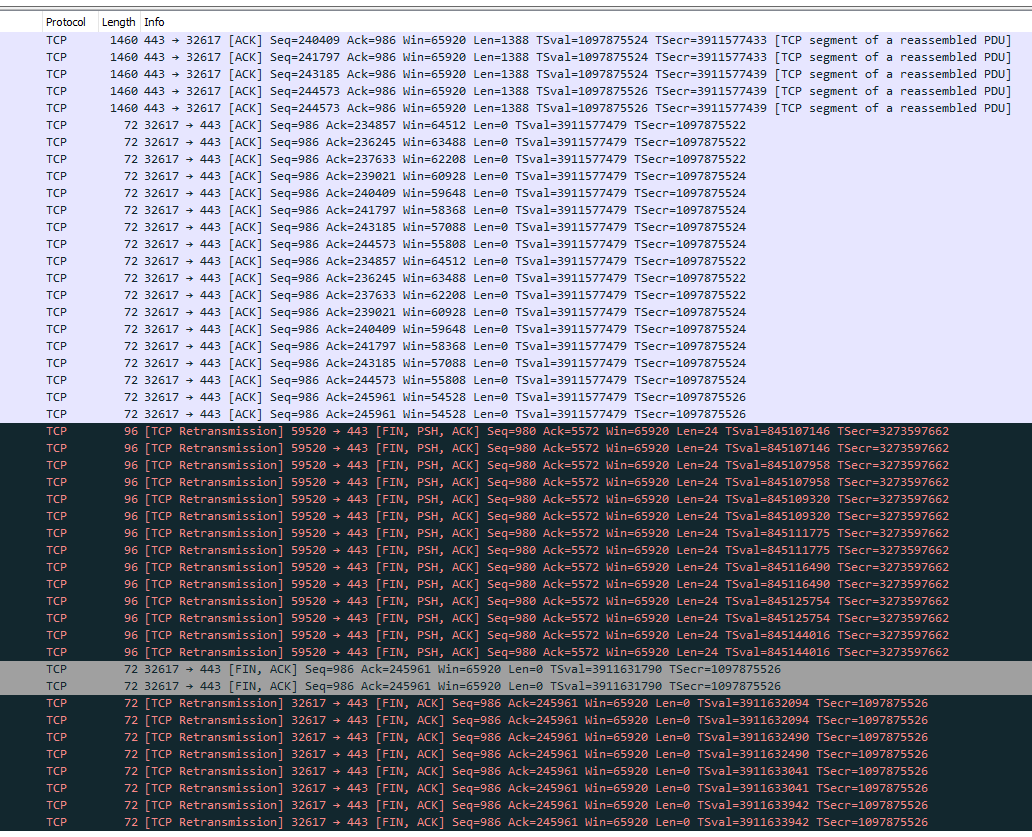
With Wireshark I can see that it hangs when it has sent [FIN, ACK]. There are plenty of TCP Retransmissions since this is not reaching the server on internet.
Firmware TRB5_R_00.07.04.3 and mode is NAT for the mobile interface.
I also have a RUT240 with firmware RUT2XX_R_00.01.14.7 and if I use it in the setup instead of TRB500, then it works.
It is hard to say what can be the issue here. Are other applications/web servers communicating properly?
How stable is your connection generally? Is the signal quality good?
One potential issue could be the MTU. Recent firmware updates have altered the way the MTU is determined. Hence, you could try adjusting the MTU for the mobile interface. You can change the MTU by navigating to Network → Interfaces → Edit Mob1s1a1 interface and setting a custom MTU in the advanced settings. You can try different values, like 1400, 1300, etc.
MTU, no I don’t think that is the issue. The TCP FIN-ACK packages that doesn’t flow through the TRB500 are 66 bytes long and all the other packets in the TCP-stream are 1454 bytes.
I am guessing now since I’m not an expert on TCP-flows, but in layman terms, it looks like the connection state in TRB500 is lost and hence it just drops these packages.
As I wrote in the first message, please note that this behaves correctly if I replace TRB500 with the RUT240 in my setup.
Of course I want the 5G speed so the RUT240 is not the solution of the problem
Could you enable logging for the wan => lan zone on the TRB500 ?
Go to Network->Firewall->General settings, use the pen to edit the wan=>lan rule, in Advanced settings set “Enable logging for this zone”.
Check with logread -f if you have messages containing “DROP wan in:” or “REJECT wan in:”. What do you see when you run your application ?
It is not possible.
After enabling logging for wan=>DROP zone and pressing “Save & Apply” this message pop-up
The lan=>wan zone was possible to enable logging on. At least in the GUI. I don’t see any logged messages in the logfile from the firewall.
Last message was: kern.info kernel: firewall configuration has been changed.
I also found “Force connection tracking” in Advanced setting and I tried to change that one from off → on. That was possible to do, but it did not solve the problem so I changed it back again to off.
What is lost exactly, the FIN ACK in the TRB → server direction or the server → TRB direction ? Or is the issue between the TRB and the PC ?
Where did you run the wireshark ?
Can you do a tcpdump on the TRB:
tcpdump -i any -n -v -s 0 -w finack.pcap ‘host the-ip-of-the-server’
do you see a FIN then FIN ACK followed by ACK on one of the interfaces ?
Where I interrupt witch Ctrl-C when the process never finish.
There are two files that it tries to fetch. The first one is very small, that one works. The second one is larger and it never fully arrives. This also means that the rest of the update of OPNsense fails.
This works without any issues if I replace TRB500 with RUT240.
So the last ACK is missing.
tcpdump should already be present on the TRB, if it isn’t use ssh o CLI console and execute:
opkg update
opkg install tcpdump
then use the tcpdump command above to capture the traffic: tcpdump -i any -n -v -s 0 -w finack.pcap ‘host the-ip-of-the-server’
I suppose that the last ACK comes back from the remote server but for some yet unknown reason it is not forwarded to the ethernet port.
If this is the case something is amiss in the firewall rules.
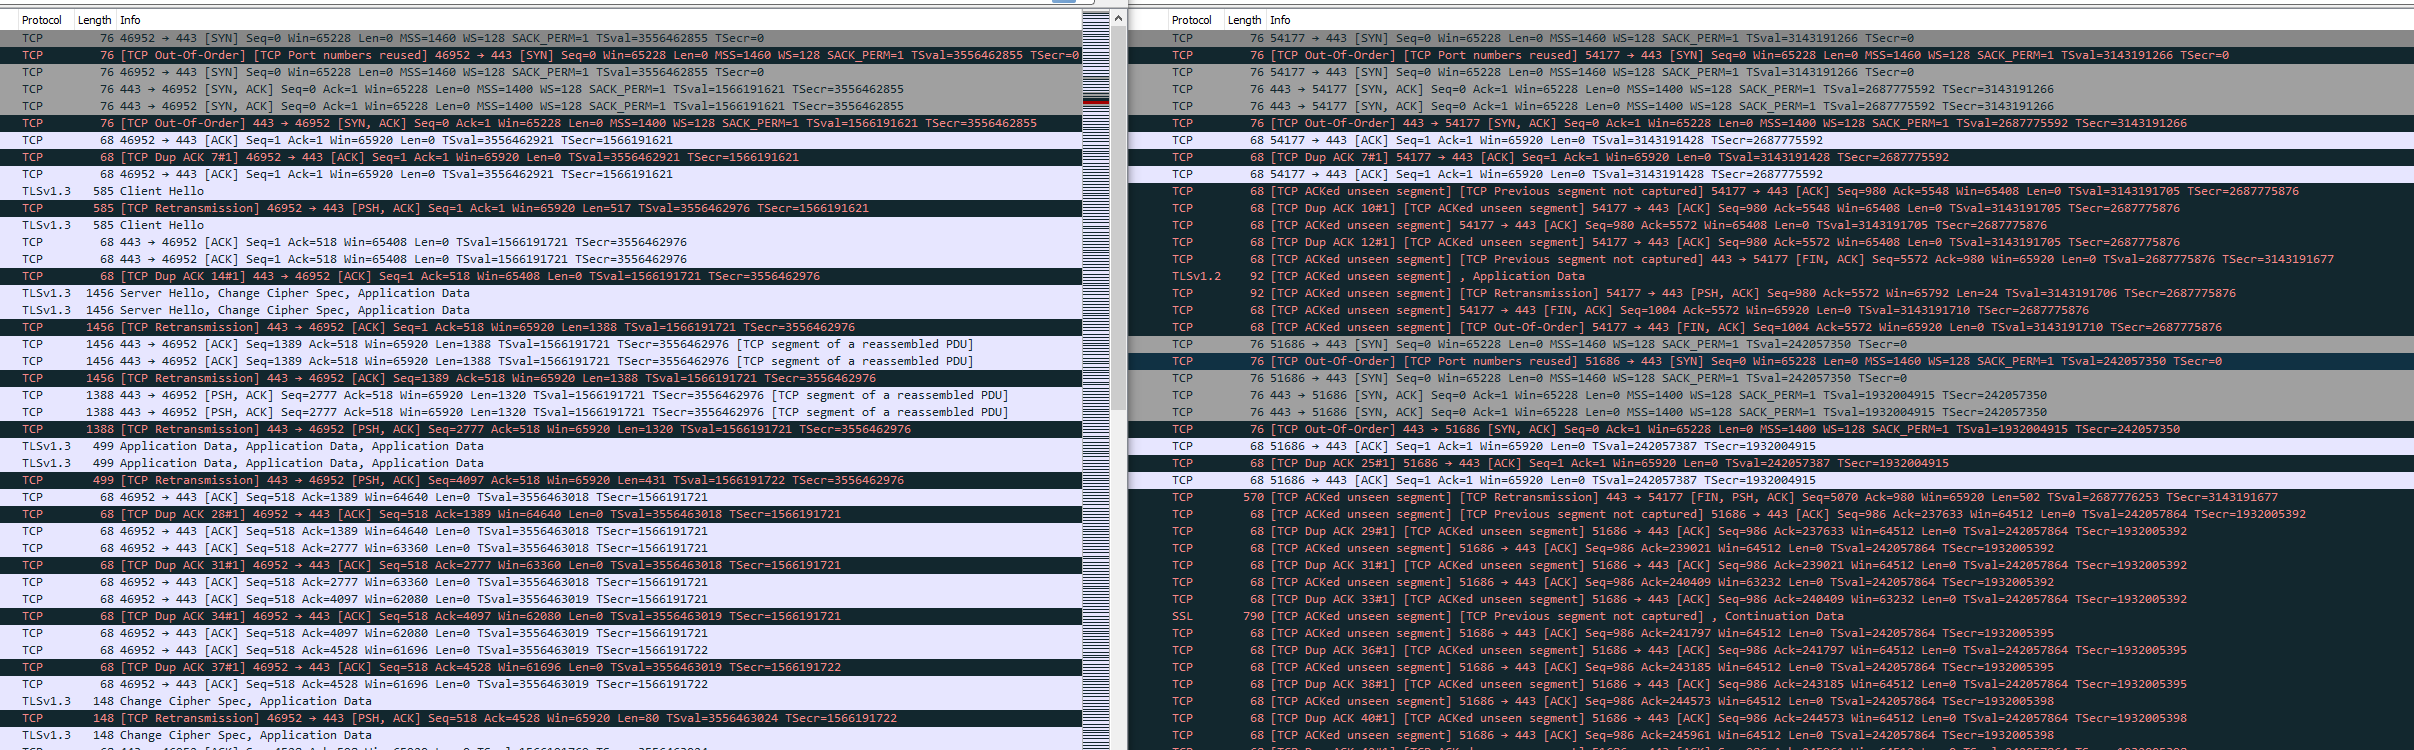
Left picture is when traffic (the one that works) passes through RUT240 and the right one when it tries to go through TRB500.
tcpdump said ‘0 packets dropped by kernel’ in RUT240 when I interrupted tcpdump.
In TRB500 it said 86 packets was dropped by kernel. The exact number probably doesn’t mean anything, it is probably depending on how long I wait until I cancel the client that is stuck. I guess it means anything more than 0 is not good when it is tcp traffic?
This is unrelated traffic, nothing to see there. Or so I think.
Unfortunately, none of the captures show the FIN - FIN ACK - ACK sequence.
Another way to do the capture is: tcpdump -i any -n -v ‘host the-ip-of-the-server’
the output will be in text mode and only the last lines are interesting.
As this is probably a firewall issue you can do a:
iptables-save > ipt.txt
on both devices, and compare the results. Look at lines containing the word ctstate.
I tried modifying the fw rules as suggested but it did not affect anything so I changed it back again.
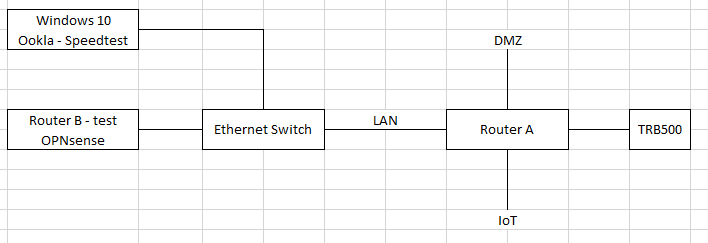
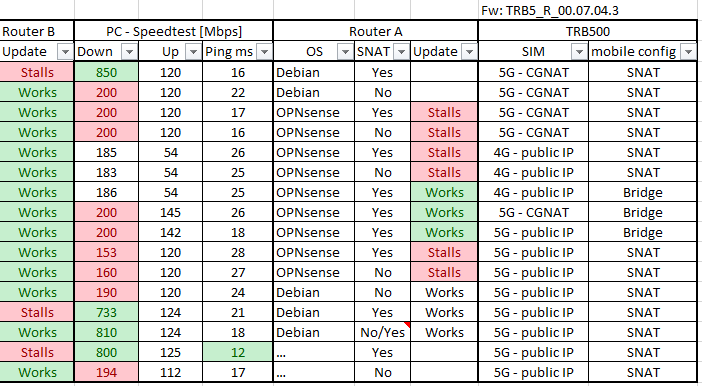
Have been spending some time now to document what works and not since I actually have two issues and I realized I needed a better overview of the situation.
In router A, I have tried with two separate disks, one with OPNsense and one with Debian.
The only combination where I could update OPNsense was when TRB500 was in bridge-mode. However, then I “only” got 200 Mbps in throughput with the speedtest. I can’t figure out if that limitation is in OPNsense/FreeBSD, TRB500 or if it is a throttle-back in the core-net of the mobile network for some reason?
I replaced Router A with another small router and was surprised to see how well it worked, at least speed and connectivity. Looks like I have to abandon OPNsense for this smal box instead (I don’t want to “advertise” here which router it is since it is from another manufacturer) .
Still, the odd thing is that I need to do SNAT in two routers to be able to get full performance in the speedtest.
I can accept that I need to handle the traffic in two different ways. One with SNAT, and one without SNAT in Router A.
Green and red colors are my highlights in the table of good/bad. The exact figures are not directly comparable with each other. They are single tests and taken during different times, i.e. different traffic loads on the cell tower also from other users.
I only did few tests in bridge mode and did not take any screen shot where I can see MTU size. But I never changed it so I would expect it to have been standard 1500 bytes. I can check if it is important, but not quickly.
Currently, TRB500 in nat-mode has 1500 bytes: rmnet_data0@rmnet_ipa0: <UP,LOWER_UP> mtu 1500 qdisc mq state UNKNOWN group default qlen 1000
The small router I have now reports it is capable of L2 MTU of 1596 bytes but actual size in use is 1500.
Router hardware I used for Debian and OPNsense has a Intel Celeron J4125 Quad Core with 8 GB DDR4 RAM, capable of up to 2.7 GHz.
Yes please check it.
And what is the output of: gsmctl -A "AT+QMTUINFO"
on the TRB ? What is the the value of the MTU on the wan interface of the TRB ?
Hey, just a random thought but this looks to me like an MTU issue on mobile interface. If you notice the TCP MSS adjustment, RUT240 seems to attempt negotiating MSS value of 1460, but server brings it down to 1400. Also, the IP (L3) packet lengths do not seem exceed 1456 bytes size whereas in a non-working scenario they go up to 1460.
Could you try to reduce MTU on your TRB500 mobile interface to something like 1420, 1440 or 1460 (try multiple values if one doesn’t work)? In theory, reducing it even by something like 10-15 bytes (down to 1490-1485) might make things work, but lower will ensure that some extra space is left over for overhead, in case it’s ever needed.
You can set a custom MTU value by editing mobile interface, at advanced settings.