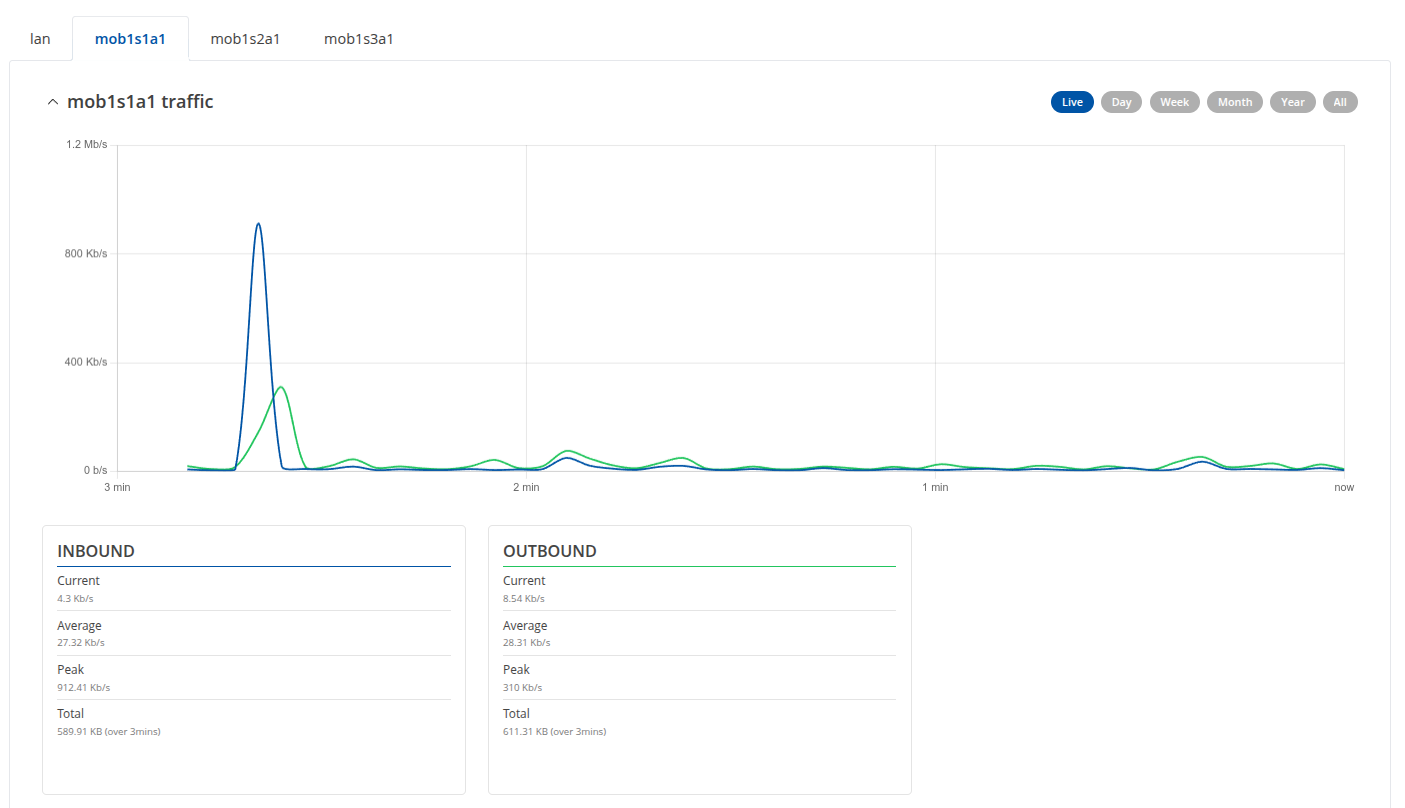
How can I create a graphic designer in RMS to see live traffic, without therefore accessing directly on the apparatus?
A graphic similar to what I would see by accessing on the apparatus to: status, reality data, traffic,:
Good afternoon,
Thank you for your query.
We are currently working on it, and will be back with a response as soon as possible.
Thank you for your patience,
Regards,
Teltonika Team
Hi there,
If you go to RMS Devices ->Device details → and above you have Metrics, mobile data information, or Data usage. I would recommend exploring that particular place in RMS to see if you can find your graphs.
If that is not what you are after, please advise.
Regards,
Arturas
Hi Arturas,
I already explored this section:
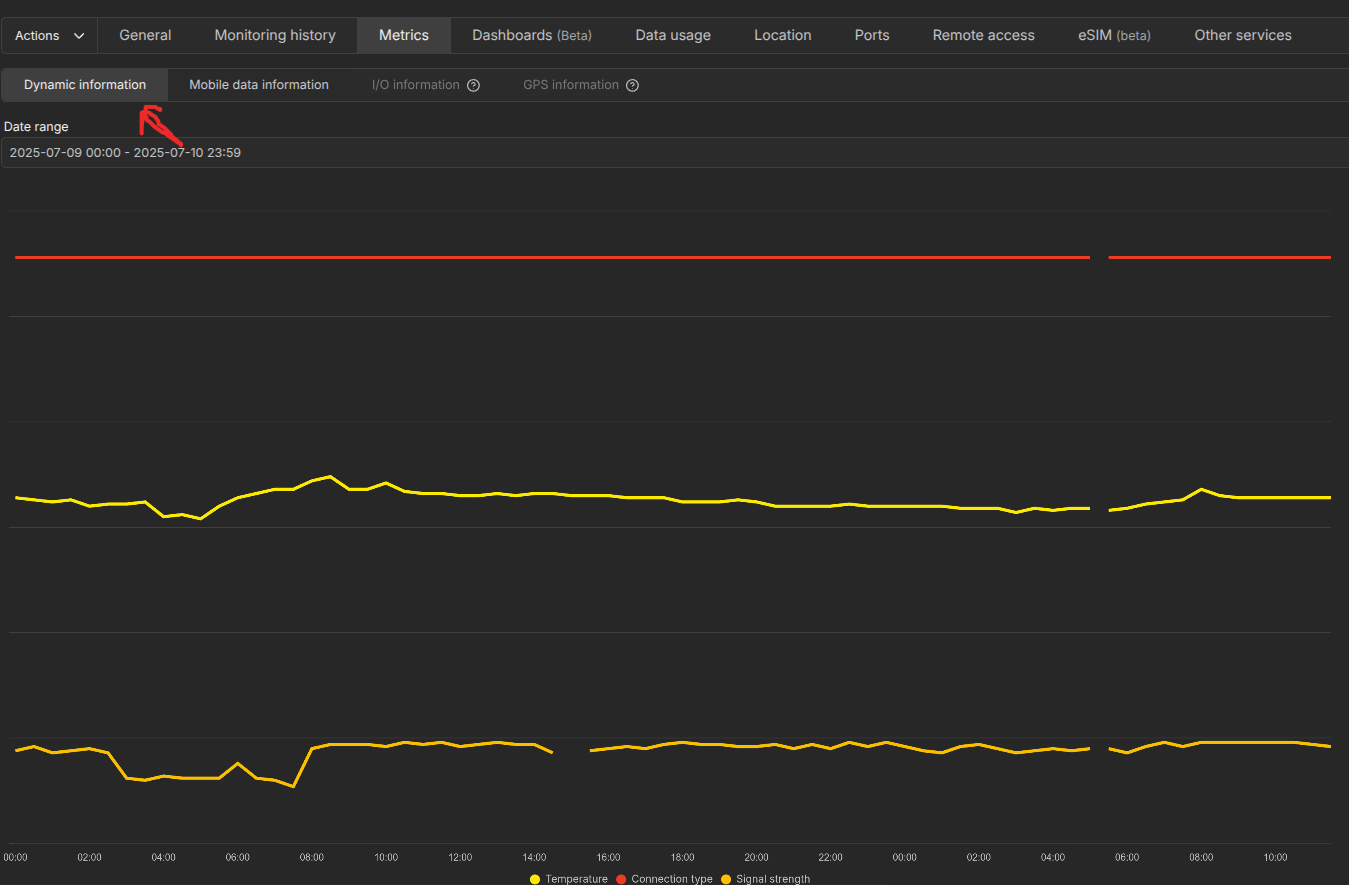
“Dynamic information” in this section there are the principal information, Temperature, connection type, and signal strenght
“mobile data information” there is a total of download and upload for sim:
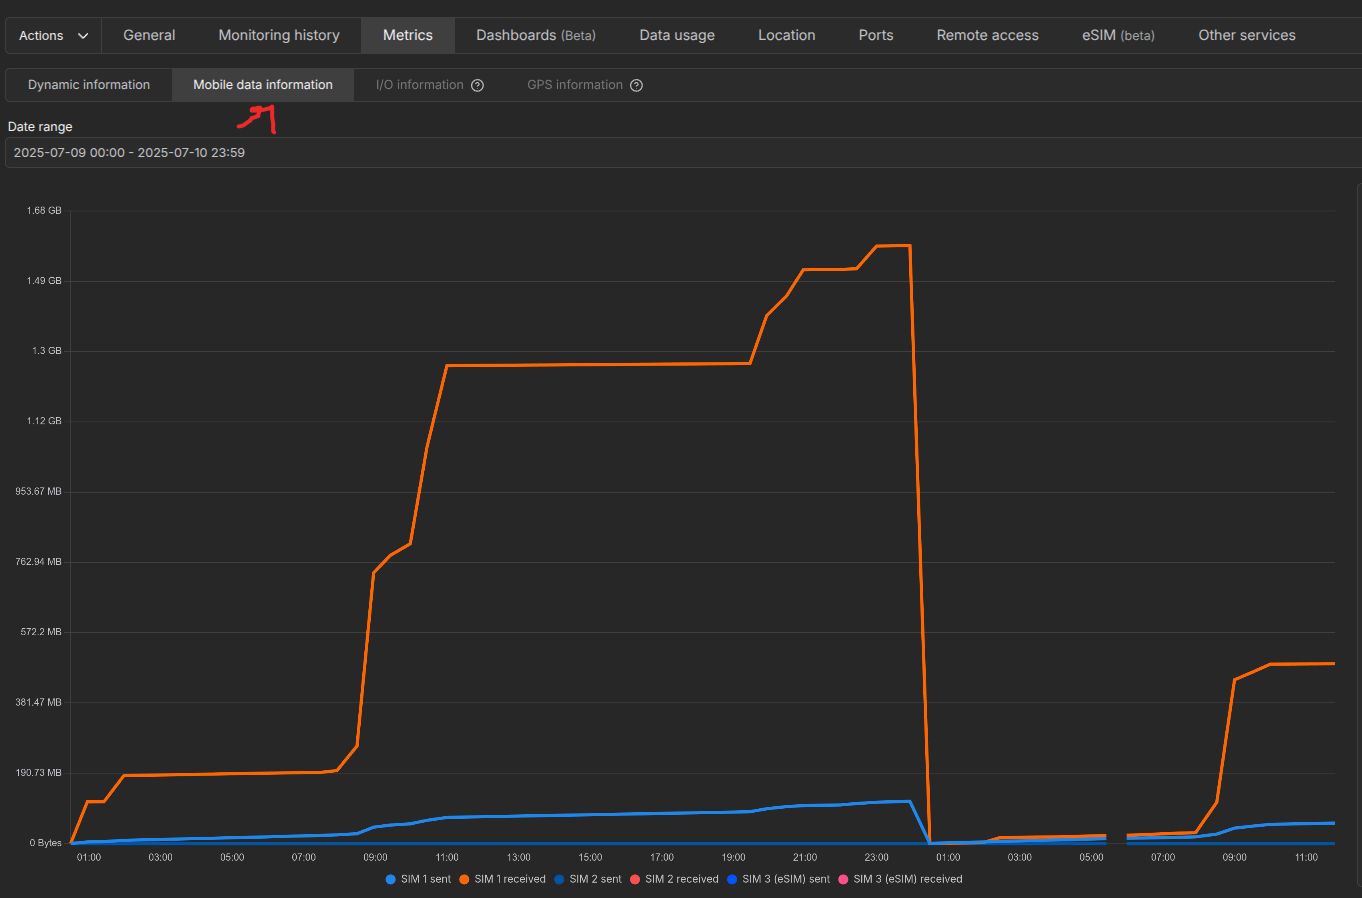
there aren’t other information for connection Realtime data trasfer live or other information of quality band connection 4G and 5G
Hi there,
Have you tried looking into RMS monitoring dashboards? Link to guide: Template:RMS Monitoring Dashboards - Teltonika Networks Wiki
You can create different widgets, to represent live data from the router.
Regards,
Arturas
Hi,
it is an excellent idea, but in the “monitoring parameters” I can’t find “inbound” and “outbound” parameters for sim “mob1s1a1”, “mob1s2a1”.
Could you help me?
Hi there,
Due to the difference in how the RMS system, and the WEBUI of the device operates, you are able to view realtime live data in the WEBUI, and the data in RMS only gets pulled periodically. By default it’s set to 5 minutes. If you go to your dashboards, and in mobile data information you choose interval as last 20 minutes or so, you will be able to see the increase in 5 minute intervals.
Regards,
Arturas
Hi,
and how can insert widget with “inbound” and “outbound” parameters for sim “mob1s1a1”, “mob1s2a1” with 5 minute intervals ?
Thanks
Hi there,
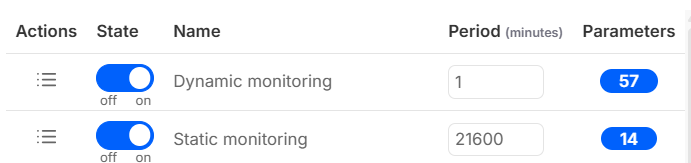
For widgets, I would firstly recommend going to your devices in RMS, choose the device in question, press on actions, management, manage monitoring templates. On the screen appeared, depending on the templates you have active, you need to change the period of updates to 1 minute (it is 5 by default). (see screenshot)
After that, click save. Wait a little bit for the system to sync.
Go to that devices dashboards, and when you create a widget, the values to choose would be these (See screenshot)
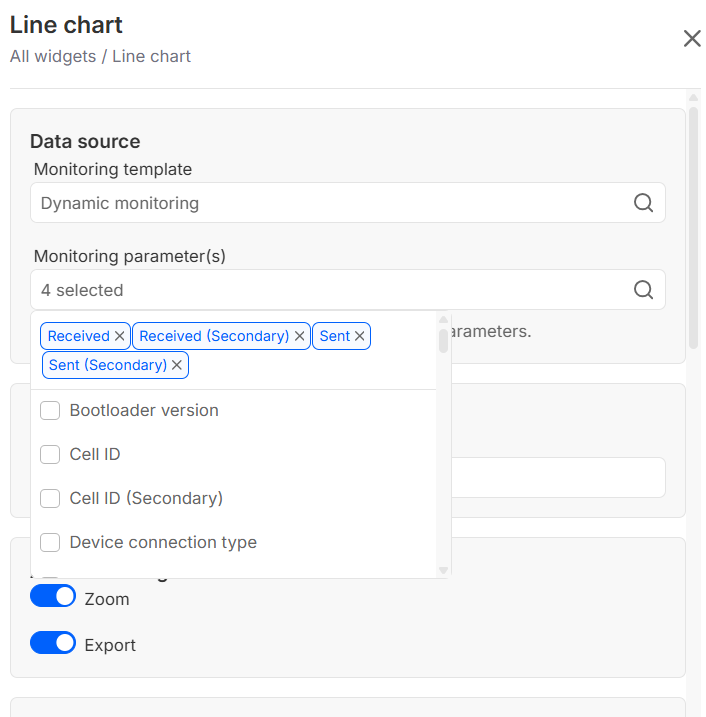
When you press save after that, you will be able to see values increasing every minute, for sent and received data, for both sim cards. Do note that the data presented there is in bytes, and 1000 bytes is 1 kilobyte. I am only adding this for easier conversion, and do want to note that conversion in the app itself is on the agenda for our RMS team for future updates.
Regards,
Arturas
Hi,
I configured windget, for data analysis by default it is set to 15 minutes, is there a possibility to change this parameter to 1 day and leave it active every time I access the graph?
Hi there,
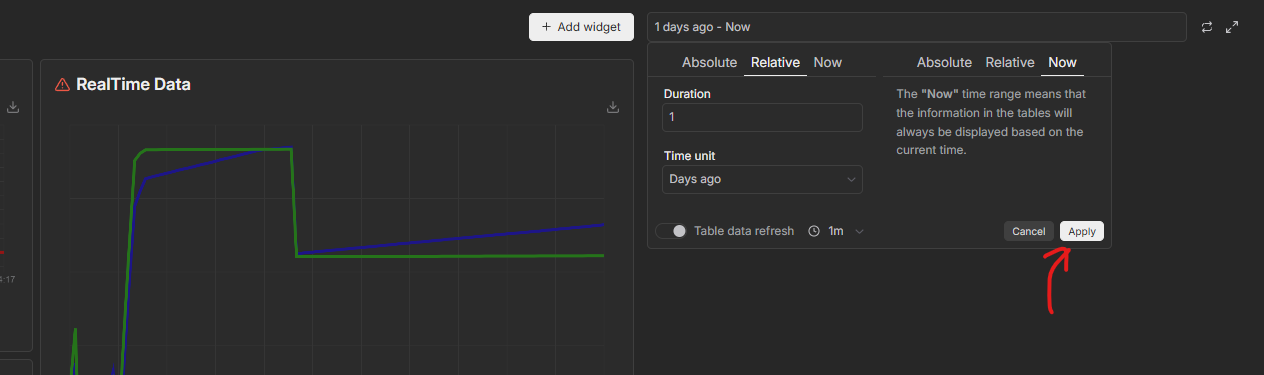
If I understand you correctly, you need to change the table data refresh in the bottom of the picture to 24h.
The widget will remain active, if after creation, you press the save button above the widget.
Regards,
Hi,
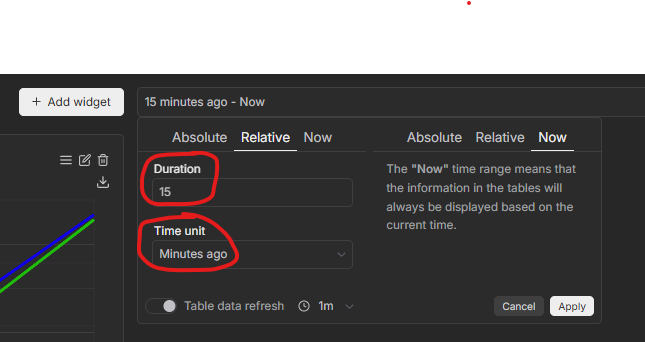
I change duration to 1 and time unit to day ago, press button “Apply”, but there isn’t any button “save”
Hi there,
After you create a widget, you get an option to save it :
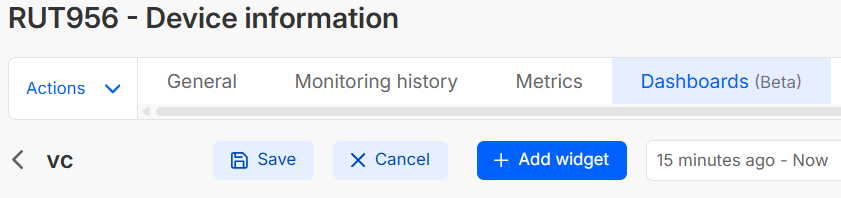
Please do so only after amending all your settings.
Regards,
Hi,
after i press button “Apply” there isn’t button save
Hi there,
Step by step, you would need to firstly make your choices in the absolute relative now as in your photo, then apply.
Create the widget then, and save it. You will have the widget up to your above advised specs.
Regards,
Arturas
This topic was automatically closed after 60 days. New replies are no longer allowed.