RMA status code 0

I have one of my router connected to Teltonika system derive information. All work well, but recently the router try to reconnect to the system by the log on Tetonika site says:

The device is redirected to the authentication system. 0 2025-11-18 16:39:37
The device is redirected to the authentication system. 0 2025-11-18 16:20:05
The device is redirected to the authentication system. 0 2025-11-18 15:49:17

This router runs a vpn client that every-time is online try to reconnect to the server, however on the server site i see some interaction between server and the router. here how it looks on server log:
2025-11-18 16:50:50 1.1.1.1:5764 TLS Error: TLS key negotiation failed to occur within 60 seconds (check your network connectivity)
2025-11-18 16:50:50 1.1.1.1:5764 TLS Error: TLS handshake failed
2025-11-18 16:50:50 1.1.1.1:5764 Fatal TLS error (check_tls_errors_co), restarting
2025-11-18 16:50:50 1.1.1.1:5764 SIGTERM[soft,tls-error] received, client-instance exiting

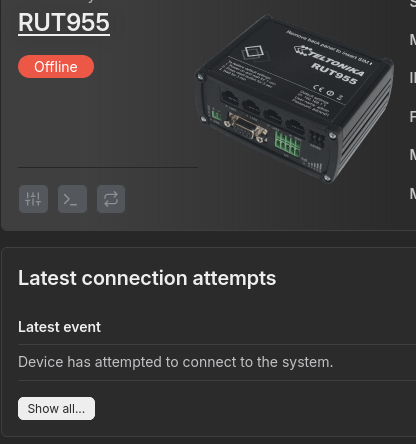
The vpn connection worked without any problem for days. Always reconnect properly. Usually put down the vpn server restore the connection to the Teltonika RMS system, but not this time. What can be the problem.

Greetings, ptroms,

Welcome to Teltonika Community!

To better understand the situation, could you please clarify the following:

  • On which server is your RMS VPN Hub hosted?
  • Do the affected devices still have an active internet connection?
  • Have you already tried re-pushing the certificates to the clients?

To re-push the certificates, navigate to RMS VPN → VPN hubs, select your hub, open the Clients tab, and use the button shown in the screenshot below:

Once I have this information, I will be able to assist you more effectively.

Kind regards,
V.

Great
I have been playing around with some free time.
In therms of the screenshot from Teltonika RMS user account.

As you can see there is no info.

That how it looks last 72h.
What I gave discovered that the vpn server <=> client connection works fine
Here is my investigation.
The router has super slow internet access. But what catch my attention is the internal data flowing around.


root@Teltonika-RUT955:~# iptables -Z
root@Teltonika-RUT955:~# date
Wed Nov 19 16:04:11 UTC 2025
root@Teltonika-RUT955:~# iptables -v -L
Chain INPUT (policy DROP 0 packets, 0 bytes)
 pkts bytes target     prot opt in     out     source               destination         
   24  1824 ACCEPT     all  --  lo     any     anywhere             anywhere             /* !fw3 */
 581K  191M input_rule  all  --  any    any     anywhere             anywhere             /* !fw3: user chain for input */
  288 29864 ACCEPT     all  --  any    any     anywhere             anywhere             ctstate RELATED,ESTABLISHED /* !fw3 */
    0     0 DROP       all  --  any    any     anywhere             anywhere             ctstate INVALID /* !fw3 */
 581K  190M zone_lan_input  all  --  br-lan any     anywhere             anywhere             /* !fw3 */
....
....
root@Teltonika-RUT955:~# date
Wed Nov 19 16:06:16 UTC 2025

As you can see in about two minutes the local traffic hits around 200M of data. Table mangle and raw is quiet.
The “br-lan” traffic is massive, however wwan0, and tun_c_a very little data flowing around:

br-lan    Link encap:Ethernet  HWaddr 00:11:22:33:44:55  
          inet addr:192.168.1.1  Bcast:192.168.1.255  Mask:255.255.255.0
          UP BROADCAST RUNNING MULTICAST  MTU:1500  Metric:1
          RX packets:416677440 errors:0 dropped:0 overruns:0 frame:0
          TX packets:3504 errors:0 dropped:0 overruns:0 carrier:0
          collisions:0 txqueuelen:0 
          RX bytes:47665425180 (44.3 GiB)  TX bytes:1145868 (1.0 MiB)
tun_c_a Link encap:UNSPEC  HWaddr 00-00-00-00-00-00-00-00-00-00-00-00-00-00-00-00  
          inet addr:10.8.0.2  P-t-P:10.8.0.2  Mask:255.255.255.0
          UP POINTOPOINT RUNNING NOARP MULTICAST  MTU:1500  Metric:1
          RX packets:1532 errors:0 dropped:0 overruns:0 frame:0
          TX packets:1564 errors:0 dropped:0 overruns:0 carrier:0
          collisions:0 txqueuelen:500 
          RX bytes:154392 (150.7 KiB)  TX bytes:341543 (333.5 KiB)
wwan0     Link encap:Ethernet  HWaddr AA:BB:CC:DD:EE:FF  
          inet addr:100.107.79.254  Bcast:100.107.79.254  Mask:255.255.255.255
          inet6 addr: fe80::acc7:deff:fe30:98b8/64 Scope:Link
          UP BROADCAST RUNNING NOARP MULTICAST  MTU:1500  Metric:1
          RX packets:5444 errors:0 dropped:0 overruns:0 frame:0
          TX packets:5790 errors:0 dropped:0 overruns:0 carrier:0
          collisions:0 txqueuelen:1000 
          RX bytes:579922 (566.3 KiB)  TX bytes:800685 (781.9 KiB)

Is that normal, or the router simply dies recently?
Thank you
ptroms

logread contains tons of messages following structure:

Thu Nov 20 05:40:00 2025 daemon.info dnsmasq-dhcp[4024]: DHCPDISCOVER(br-lan) 00:11:22:33:44:44
Thu Nov 20 05:40:00 2025 daemon.info dnsmasq-dhcp[4024]: DHCPOFFER(br-lan) 192.168.1.156 00:11:22:33:44:44
Thu Nov 20 05:40:01 2025 kern.warn kernel: [13046.390000] net_ratelimit: 138044 callbacks suppressed
Thu Nov 20 05:40:02 2025 kern.warn kernel: [13046.390000] br-lan: received packet on eth0 with own address as source address
...
...
Thu Nov 20 05:40:02 2025 kern.warn kernel: [13046.460000] br-lan: received packet on eth0 with own address as source address
Thu Nov 20 05:40:02 2025 daemon.info dnsmasq-dhcp[4024]: DHCPDISCOVER(br-lan) 00:11:22:33:44:44
Thu Nov 20 05:40:02 2025 daemon.info dnsmasq-dhcp[4024]: DHCPOFFER(br-lan) 192.168.1.156 00:11:22:33:44:44

I think it happened when I tried to flip the wlan build-in card as a lan.

Solution:
Putting down eth1, restores the connection over web UI, and then restore WAN2 as a failover solve the problem.

This topic was automatically closed 2 days after the last reply. New replies are no longer allowed.