Hello,
I updated one my device (rut 241) to the new version 7.08 to run test with User/Pwd authentication on OPCUA.
After configuring the OPCUA client, I tried to launch a test and I have only a simple message “failed”. But I don’t why, where, what step of the process.
Where can i find the log message on the device (/var/log is empty) ?
tkx
Hi fballandreau,
Welcome back to Teltonika Networks Community!
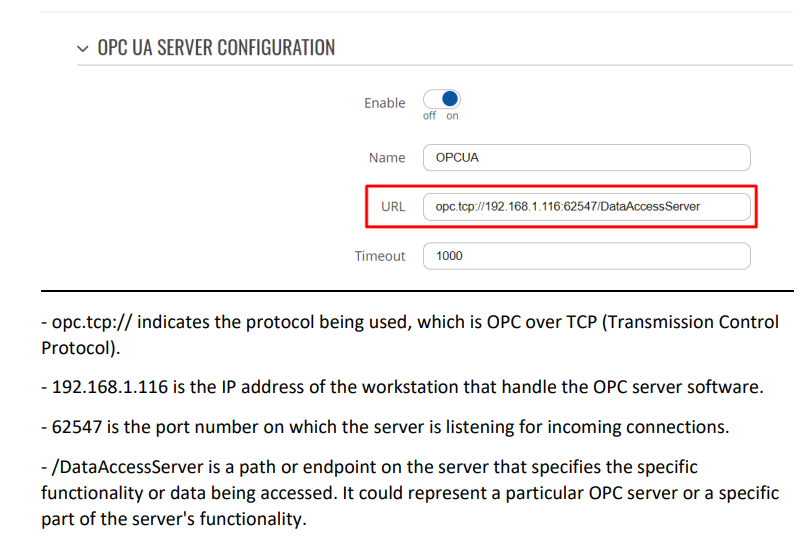
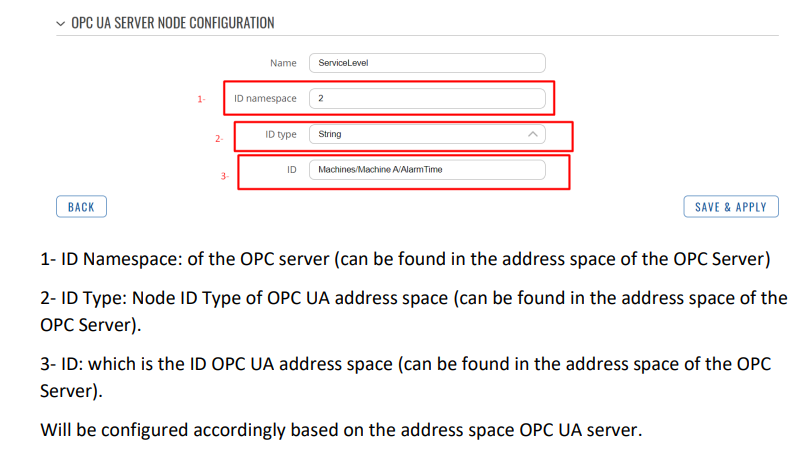
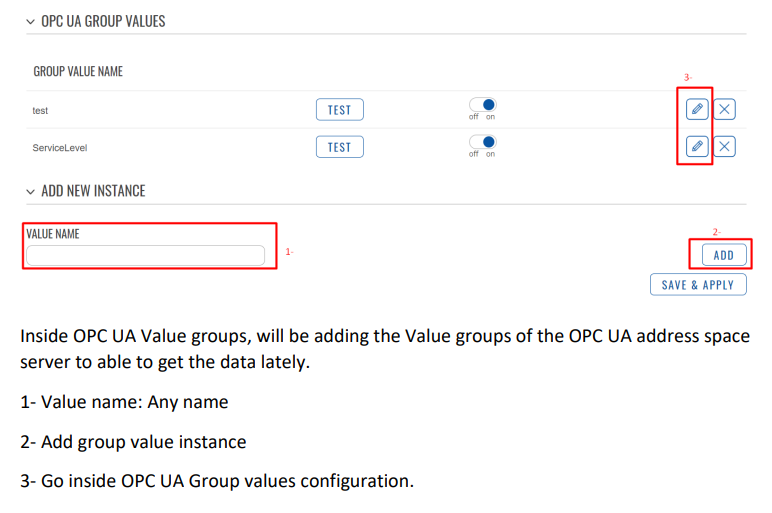
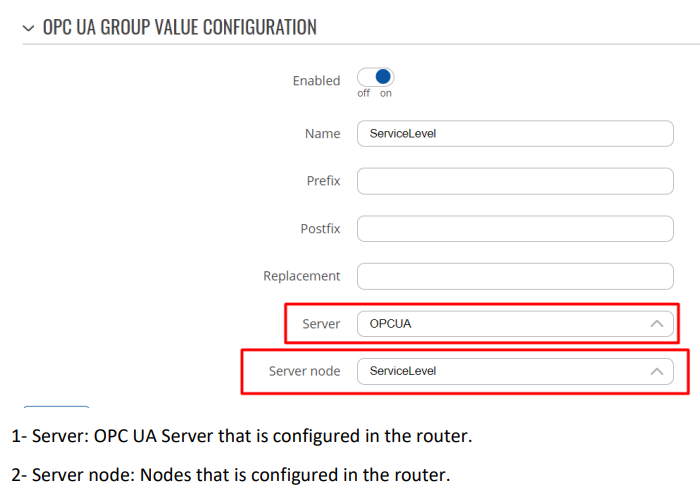
I have some screenshots on how to configure OPC UA in Teltonika devices. I used an OPC UA server simulator and pull out its data. It should be the same configuration as RUT241. Cross check the parameters especially URL, ID, ID namespace, and ID type.
Let me know if this helps.
Regards
Thanks for your answers.
How do you access the OPCUA client log because it’s easier to find a network problem than to use wireshark.
I checked with my own OPCUA server and I have the right configuration (url, ns and node (int type about my case).
But I have a problem with a professional device (OPCUA server):
The OPCUA server only allows one OPCUA client connection at a time for security reasons.
With Wireshark, I saw that the OPCUA client (teltonika) was trying to connect with several sessions to my OPCUA server in the same time without close them. (and the test option adds a session).